Most SaaS founders I talk to can name their conversion rate to the second decimal. Almost none can tell me what fraction of their signups become activated users — because they haven’t decided what activation means. That’s the gap this article fixes. The activation funnel isn’t a single number. It’s five stages, and you need to measure each one separately to find out where users actually fall off.
I’ve built activation models for B2B tools, dev platforms, and consumer subscription apps. The labels change. The five stages don’t. This guide walks through each one, what to track, and the moment in each stage where you’ll be tempted to merge two stages into one — which is exactly where you’ll lose visibility into the problem you’re trying to solve.
Why “Activation Rate” as a Single Number Is Lying to You
When a SaaS team says “our activation rate is 38%,” they usually mean: 38% of signups eventually do the one thing the founder picked as the activation event. That number tells you almost nothing useful. It hides whether users are dropping out at email verification, during onboarding, or after their first interaction with the product. Each of those failure modes needs a completely different fix.
Splitting activation into stages turns a single opaque number into a diagnostic. You stop arguing about “is activation good or bad” and start arguing about “stage three is broken, what do we do about it.” That’s a much more productive argument.
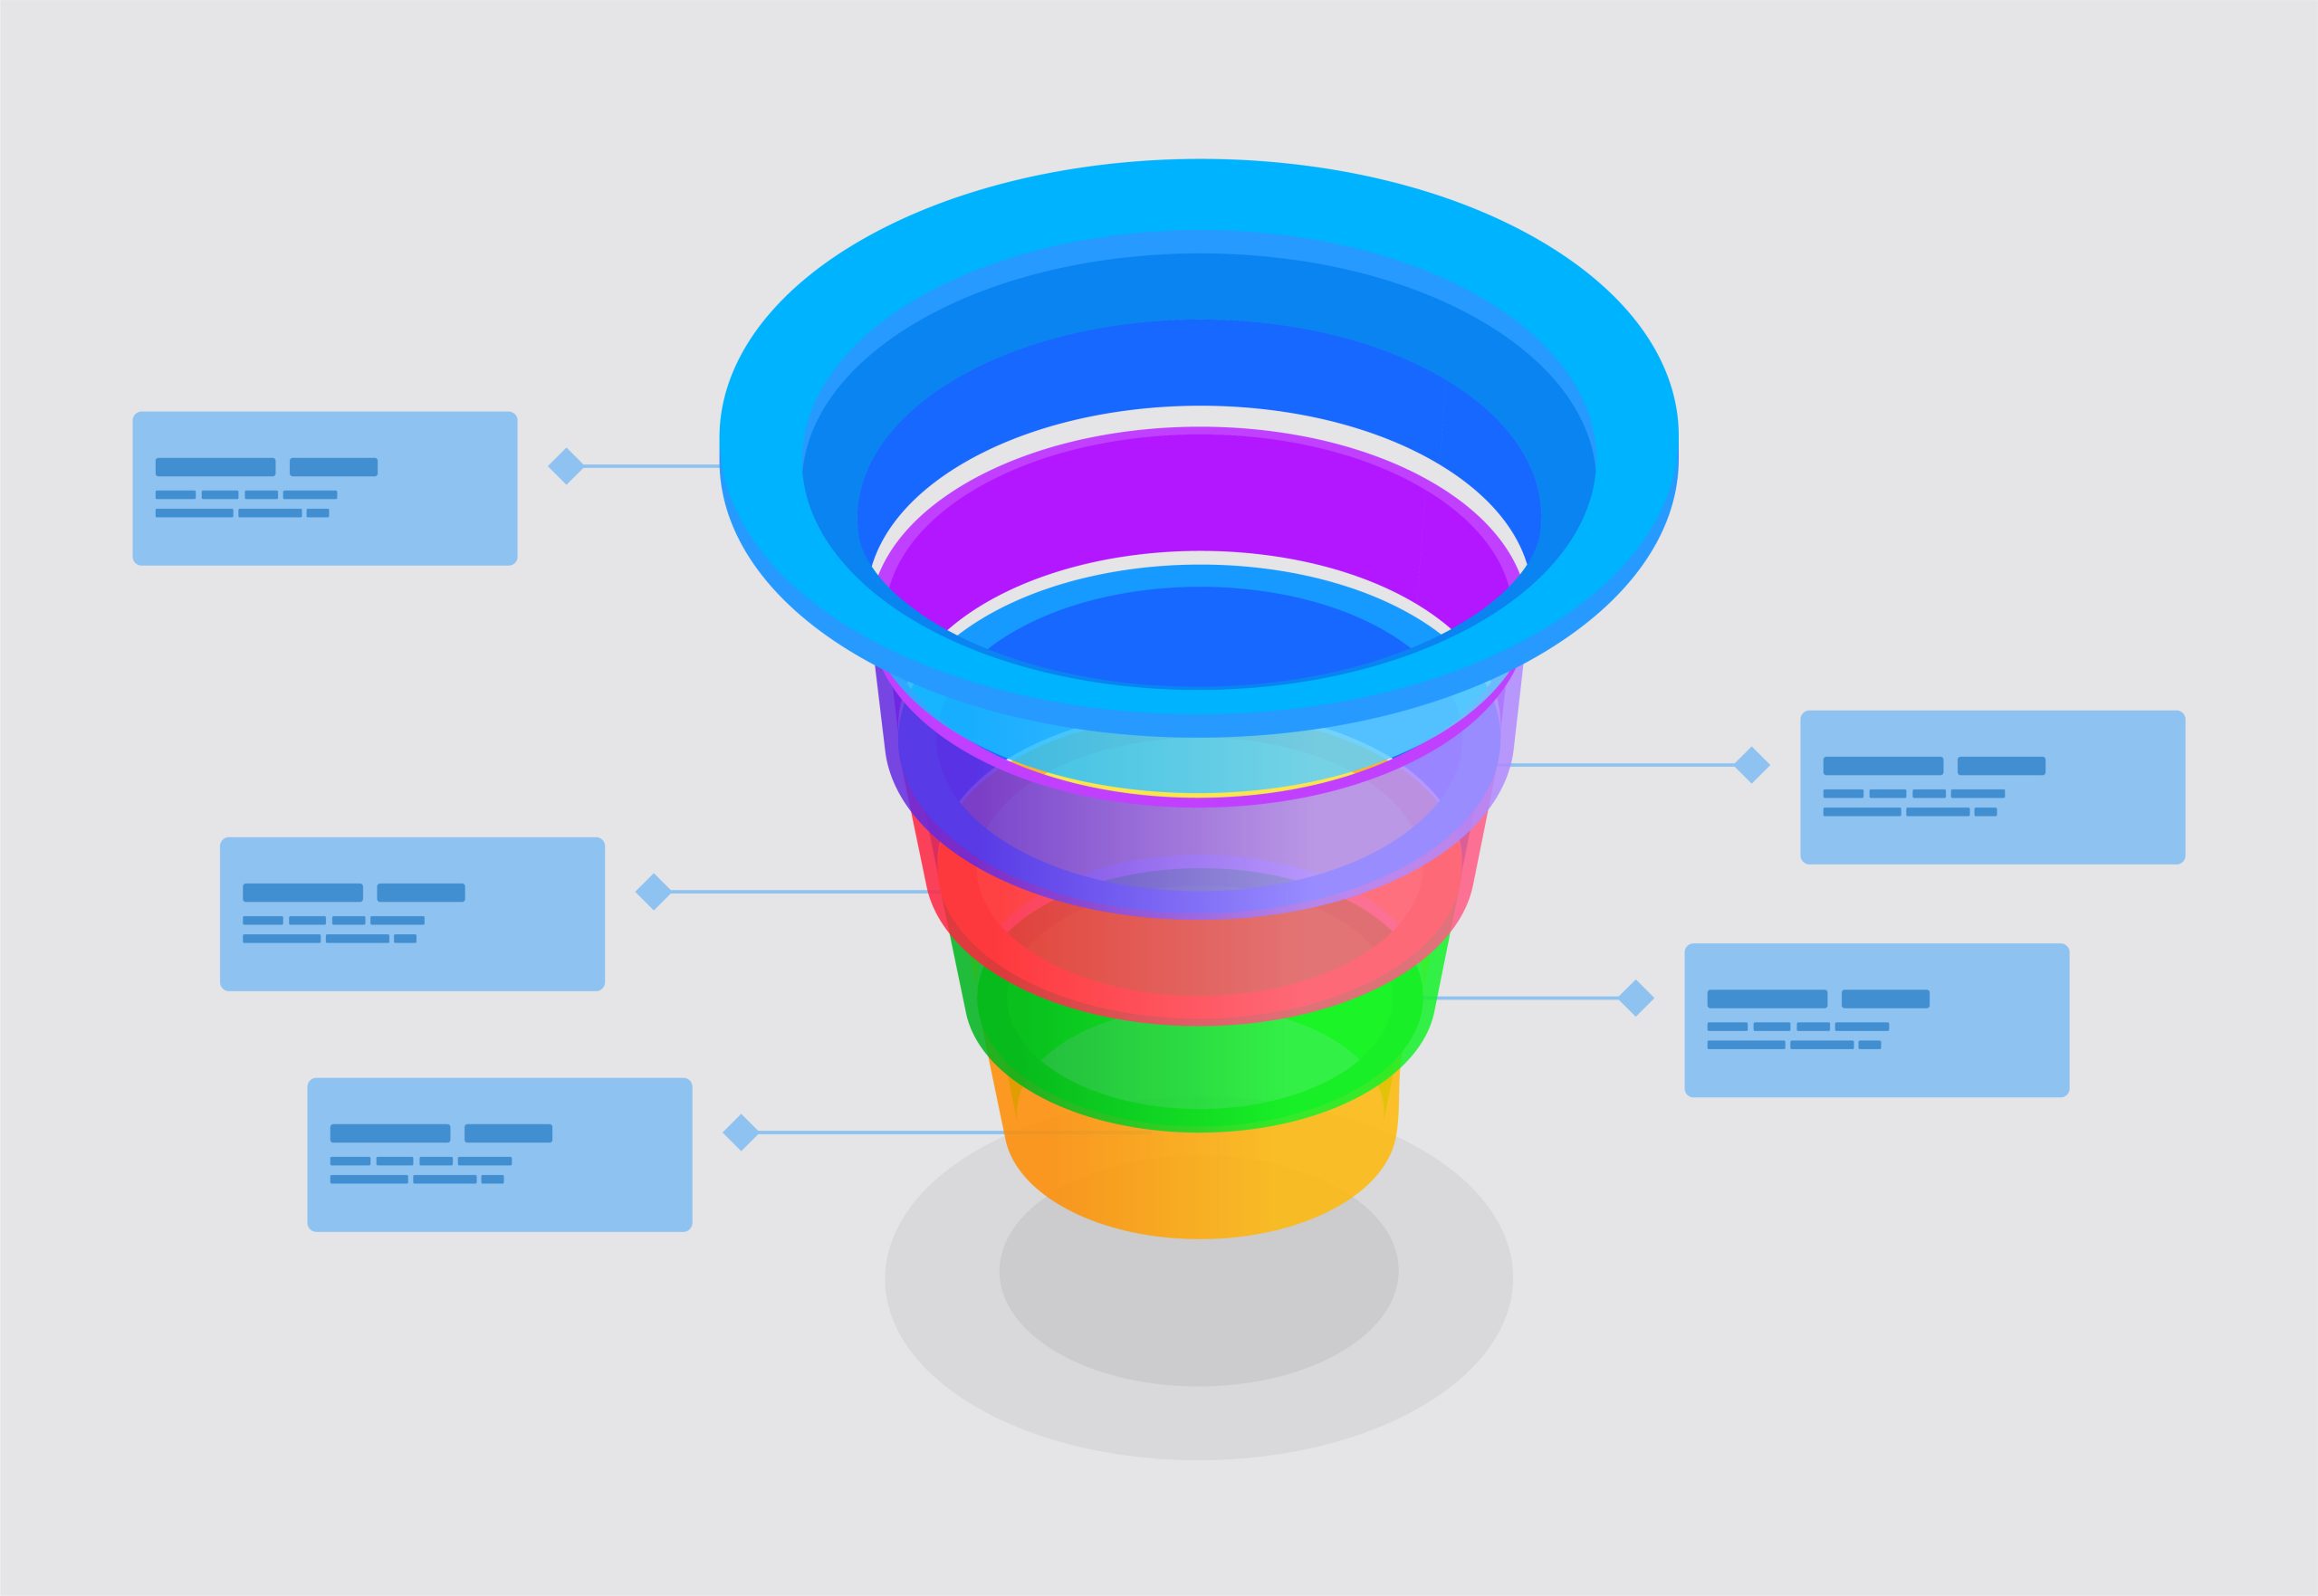
The Five Stages
Here’s the model I use, with the events I track at each stage. Adapt the event names to your domain — but resist the urge to skip stages.
| Stage | What happens | Event to track | Drop-off cause |
|---|---|---|---|
| 1. Signup | User commits an email or auth identity | signup_completed | Form friction, trust |
| 2. Verification | Email or SSO confirmed, account exists | account_verified | Email deliverability, ESP filters |
| 3. Setup | User completes the prerequisites to use the product | setup_completed | Onboarding length, missing context |
| 4. First Value | User does the smallest thing that delivers the product’s core promise | first_value_event | Discoverability, empty state |
| 5. Habit | User returns and repeats the value action | habit_event | Lack of trigger, low motivation |
Stage 1 — Signup
The signup stage starts when a visitor lands on your signup page and ends when they submit valid credentials. The conversion rate here is mostly a function of form length, perceived effort, and trust signals. If you’re losing more than 50% of visitors who reach the signup page, this is your first lever.
Track signup_started when the form gets focus and signup_completed on submit. The ratio between them is your form completion rate, which is far more actionable than the ratio of pageview-to-signup.
Stage 2 — Verification
This is the stage almost every team I audit forgets to measure. Between signup and verification, you typically lose 5% to 25% of users — sometimes more if your verification email lands in spam. The fix is rarely UX. It’s usually deliverability: SPF, DKIM, ESP reputation, the subject line of the verification email.
Track verification_email_sent, verification_email_opened, and account_verified. The gap between sent and opened tells you whether your emails are reaching inboxes. The gap between opened and verified tells you whether the verification flow itself is broken.
Stage 3 — Setup
Setup is whatever the user must do before the product can deliver value: connect a data source, invite teammates, install a script, configure a project. This is the biggest leakage point for technical SaaS products. A 40% drop-off here is normal and very fixable.
The trick is to measure setup as a sub-funnel of its own. If setup has five steps, track an event for each: setup_step_1_completed through setup_step_5_completed. Then look at the conversion between adjacent steps. The step with the worst rate is your culprit.
Stage 4 — First Value
This is the moment the user experiences the smallest possible version of what your product does. For a project management tool, it’s creating the first task that gets assigned. For an analytics tool, it’s seeing the first chart populated with their own data. For a dev platform, it’s the first successful API call.
Pick this event carefully. It must be small enough that any motivated user can reach it within 10 minutes of finishing setup, and meaningful enough that the user feels something. “First click” is too small. “Subscribed to a paid plan” is too late. Aim for the smallest action that lets the user say “OK, this thing actually works.”
Stage 5 — Habit
Activation isn’t complete until the user comes back. The habit stage is where you measure whether the first-value moment was strong enough to pull them in a second time. The classic threshold is a return visit within seven days, but the right window depends on your product’s natural cadence. A weekly reporting tool might use 14 days. A daily standup tool might use 48 hours.
Track habit_event as a repeat of the first-value event after the first session. Users who hit habit are activated. Users who don’t are at-risk and worth a re-engagement campaign.
How to Calculate the Whole Funnel
Once you have the five events, the funnel is just a series of conversion rates between adjacent stages. I display it as a table for the team and as a chart for stakeholders. Here’s an example from a recent SaaS engagement:
| Transition | Conversion | Drop-off |
|---|---|---|
| Signup → Verification | 82% | 18% |
| Verification → Setup | 71% | 29% |
| Setup → First Value | 54% | 46% |
| First Value → Habit | 61% | 39% |
| Signup → Habit (overall) | 19% | — |
The top-level number — 19% activated — is what most dashboards would show. But the diagnostic is in the middle row: setup-to-first-value is bleeding 46% of the user base. That’s where the next sprint’s effort should go, not into another homepage redesign that affects the signup rate by half a point.
Common Mistakes
- Picking too many activation events. Pick one first-value event per persona. If you have three personas, run three funnels in parallel — don’t merge them.
- Setting the habit window too short. Daily-return is a great metric for a daily-use product and a misleading one for a weekly tool. Match the window to your product’s natural cadence.
- Counting setup completion as activation. Setup means the user finished onboarding, not that the product worked for them. These are different stages and they fail for different reasons.
- Ignoring the verification stage. If your activation rate dropped suddenly with no other changes, check email deliverability before anything else. I’ve seen 12-point activation drops caused entirely by a new ESP filter.
FAQ
What’s the difference between activation and onboarding?
Onboarding is the experience you design — the tour, the checklist, the empty state. Activation is the outcome you measure — whether the user actually reached first value and came back. A great onboarding can fail to drive activation if the first-value moment isn’t strong enough, and vice versa.
How long should it take to reach the habit stage?
For most B2B tools, within 7 days. For consumer apps, within 24 to 48 hours. If your time-to-habit is longer than your free trial, you’re effectively asking users to commit before they’ve experienced the product, which crushes paid conversion.
Should I run separate funnels per acquisition source?
Yes, once your volume supports it. Users from cold paid traffic activate at very different rates than users from word-of-mouth. Aggregating them masks both the bad channels and the great ones. Use the source as a parameter on every event in the funnel.
What if my product has no clear first-value moment?
That’s a product problem, not a measurement problem. If you can’t articulate what tiny thing makes a new user say “OK, this works,” your activation rate will be low regardless of how you measure it. Spend a week interviewing recently-activated users and ask them what made them stay.
Conclusion
The activation funnel is the most diagnostic measurement framework I know for SaaS. It turns a vague “we have a signup-to-paid problem” into “we lose half our users between setup step 3 and first value, and here’s the proof.” That’s the kind of clarity that gets shipped.
Pick the five events for your product. Wire them up. Look at the table after a week. The first time you see the breakdown, you’ll know exactly where to push next.
Lukas Meier
Product Analytics Specialist with 10 years of experience configuring tracking for e-commerce and SaaS products across Europe. Creator of EU-Medin.
more →