Feature adoption metrics answer a question that ships-it culture loves to avoid: did anyone actually use the thing we built? Teams celebrate a launch, watch a release-day spike, and move on — never noticing that the feature flatlined a week later. Adoption metrics are how you tell a feature that landed from one that merely shipped. And the gap between those two is where a surprising amount of roadmap effort quietly disappears.
This guide covers what feature adoption really measures, the metrics that matter, and how to track them so your roadmap is driven by what sticks rather than what’s loudest.
What Is Feature Adoption?
Feature adoption is the degree to which your users actually use a specific feature — not just try it once, but fold it into how they work. It’s distinct from activation. Activation is a user reaching first value with your product overall; adoption is uptake of one particular capability within it.
The distinction matters because a user can be fully activated and still ignore 80% of what you’ve built. Adoption metrics shine a light on that ignored 80% — which features earn their place, and which were expensive guesses. It builds directly on the activation metrics that come before it.
Shipping a feature creates a release note. Adoption is whether it creates a habit. Only one of those moves the business.
The Feature Adoption Funnel
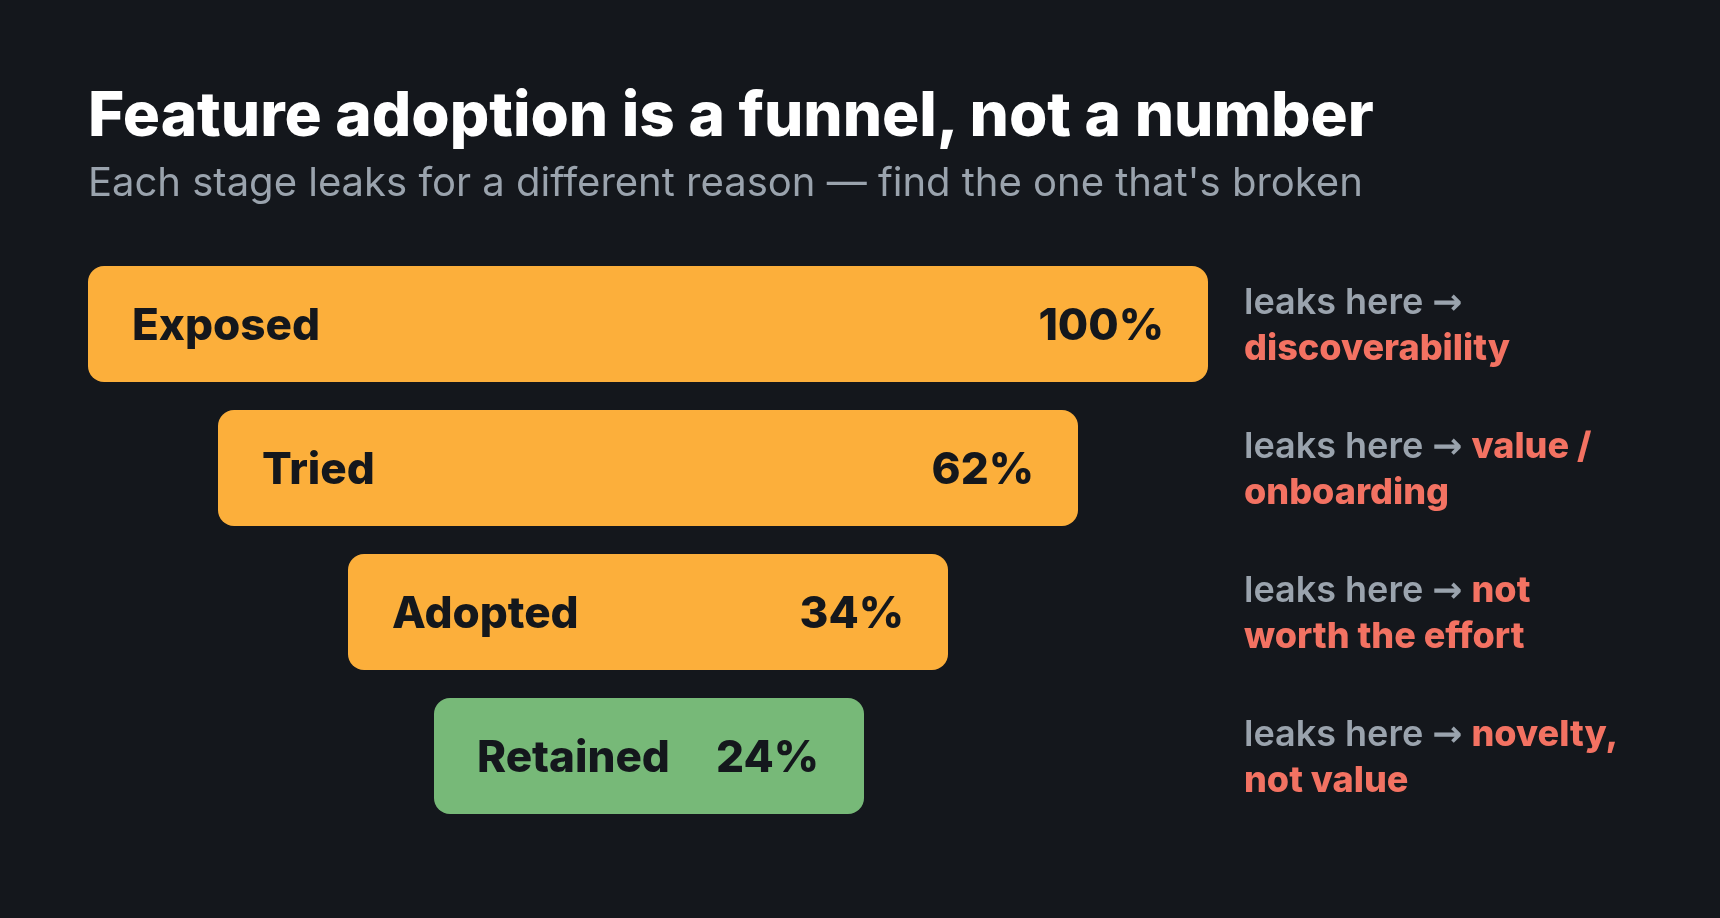
Adoption isn’t a single number — it’s a funnel, and each stage leaks differently. Knowing where a feature loses people tells you what to fix.
| Stage | Question it answers | If it leaks here… |
|---|---|---|
| Exposed | Did users see the feature exists? | Discoverability problem |
| Tried | Did they use it at least once? | Value or onboarding problem |
| Adopted | Did they use it repeatedly? | The feature isn’t worth the effort |
| Retained | Are they still using it weeks later? | Novelty, not real value |
A feature that’s tried by 60% but adopted by 5% has a very different problem from one that’s adopted by everyone who finds it but discovered by almost no one. The funnel keeps you from “fixing” the wrong stage.
The Metrics That Matter
A few well-chosen numbers cover most of what you need to know.
Adoption Rate
The headline metric: the percentage of eligible users who actively use the feature. “Eligible” matters — measure against users who could benefit, not your entire base. A collaboration feature’s adoption should be measured among team accounts, not solo users who’ll never need it.
Breadth and Depth
Breadth is how many users adopt the feature; depth is how intensely each one uses it. A feature with low breadth but high depth is a power-user tool — valuable, but niche. High breadth and low depth suggests a feature everyone touches but no one relies on. You want both numbers, because each tells a different story.
Time to Adopt
How long from first exposure to regular use? A long lag points to friction or unclear value. Shortening time-to-adopt is often the cheapest way to lift overall adoption, because the feature already works — users just aren’t getting to it fast enough.
Feature Stickiness
Stickiness — often daily-over-monthly active users for the feature — tells you whether adoption holds or fades. A feature can post great trial numbers and still be dying if stickiness trends down. It’s the truest signal of durable value.
How to Track Feature Adoption
Good adoption measurement starts with clean events, named consistently. You need to capture exposure, first use, and repeat use as distinct events — not lump them into one generic interaction.
- Instrument the funnel. Fire separate events for exposed, first-used, and used-again so you can measure each stage. A single
feature_clickedevent can’t tell trial from habit. - Define “adopted” explicitly. Decide what counts — for example, “used at least three times in two weeks.” An undefined threshold makes the metric meaningless.
- Segment by eligibility. Measure adoption among users who can actually use the feature, or you’ll bury real signal under irrelevant accounts.
This only works on a foundation of consistent event naming, which is why adoption tracking lives or dies on your event taxonomy. Vague events produce vague adoption numbers.
Common Mistakes
- Measuring trial, calling it adoption. One-time use is curiosity, not adoption. If your metric can’t tell repeat use from a single click, it’s measuring the wrong thing.
- Ignoring eligibility. Counting adoption across all users dilutes features meant for a subset, making good features look like failures.
- Celebrating the launch spike. Release-day usage is novelty. Real adoption shows up in week three, not day one.
- One metric for every feature. A power-user tool and a mass-market feature have different healthy adoption shapes. Judge each on its intent.
FAQ
What’s a good feature adoption rate?
It depends entirely on the feature’s intent and audience. A core feature should reach most eligible users; a niche power-user tool may be healthy at 10%. Compare against the feature’s purpose, not a universal benchmark.
What’s the difference between activation and feature adoption?
Activation is a user reaching first value with the product overall. Feature adoption is uptake of one specific capability. A user can be activated yet never adopt most of your features, which is exactly what adoption metrics expose.
How long should I wait before judging adoption?
Look past the launch spike to week three and beyond. Release-day usage reflects novelty and promotion; durable adoption only becomes visible once the initial attention fades and habits either form or don’t.
Should every feature be tracked for adoption?
Track adoption for features that represent real investment or strategic bets. Instrumenting every minor element creates noise. Focus measurement where the answer would actually change a roadmap decision.
The Bottom Line
Feature adoption metrics turn “we shipped it” into “they use it” — the only version that matters. Measure adoption as a funnel from exposed to retained, watch breadth and depth together, and judge each feature against the audience it was built for rather than a vanity benchmark. Most importantly, look past the launch spike to whether a habit formed. Build that discipline in and your roadmap starts compounding on what works, instead of repeatedly funding features that ship to applause and die in silence.