B2B products don’t convert in a single session. A buyer researches for weeks, loops in stakeholders, requests a demo, negotiates a contract, and finally signs — often months after the first touch. Standard e-commerce tracking can’t capture this. You need an event schema built for long sales cycles, multi-user accounts, and revenue that compounds through expansion rather than one-off purchases.
This reference covers every B2B and enterprise event you should track in GA4: from first marketing touch through sales pipeline, onboarding, product adoption, and renewal. Each event includes its trigger, key parameters, and a ready-to-use data layer snippet. I’ve used this schema across six enterprise SaaS implementations — it works whether you’re selling $50/month seats or six-figure annual contracts.
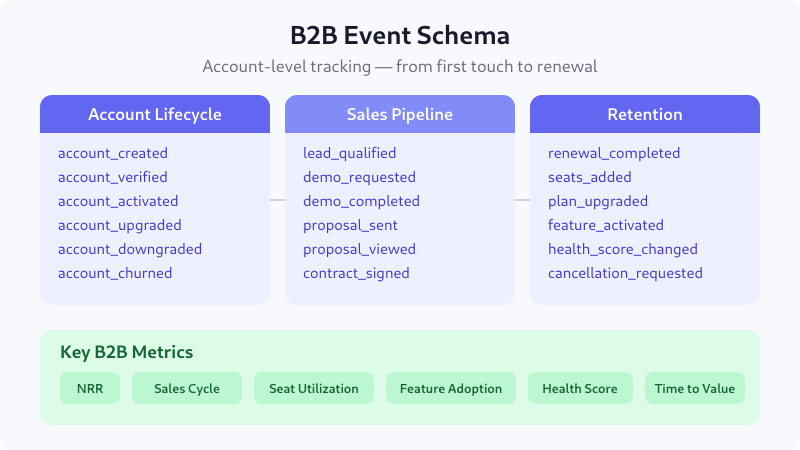
Account Lifecycle Events
B2B tracking starts at the account level, not the user level. A single account may have dozens of users, and the buying decision involves multiple stakeholders. These events track the account from creation through its full lifecycle.
| Event Name | Trigger | Key Parameters |
|---|---|---|
account_created | New company account registered | account_id, company_name, company_size, industry, signup_source |
account_verified | Email or domain verification completed | account_id, verification_method, time_to_verify |
account_activated | Account reaches activation criteria | account_id, activation_criteria, days_to_activate |
account_upgraded | Plan upgrade completed | account_id, previous_plan, new_plan, mrr_change |
account_downgraded | Plan downgrade completed | account_id, previous_plan, new_plan, mrr_change, downgrade_reason |
account_churned | Account cancellation finalized | account_id, plan, mrr_lost, churn_reason, lifetime_days |
// Account lifecycle — data layer push
dataLayer.push({
  event: "account_created",
  account_id: "acc_8k2m9x",
  company_name: "Acme Corp",
  company_size: "51-200",
  industry: "financial_services",
  signup_source: "product_led"
});
Why it matters: Account-level events let you calculate metrics that user-level tracking cannot — like account activation rate, net revenue retention, and time-to-value per company size segment. When I implemented this for an enterprise CRM, we discovered that accounts with 51-200 employees activated 3× faster than accounts with 1,000+, which completely changed the onboarding approach.
Sales Pipeline Events
Enterprise deals move through a structured pipeline. Tracking each stage lets you measure conversion rates between stages, identify bottlenecks, and forecast revenue. These events map directly to what your sales team already uses in the CRM — the difference is you’re now capturing them in your analytics stack too.
| Event Name | Trigger | Key Parameters |
|---|---|---|
lead_qualified | Lead meets MQL or SQL criteria | lead_id, qualification_type, lead_score, source, company_size |
demo_requested | Prospect submits demo request | lead_id, company_name, use_case, team_size, utm_source |
demo_completed | Live demo session finished | lead_id, demo_duration, attendee_count, demo_type, sales_rep |
proposal_sent | Sales sends pricing proposal | deal_id, account_id, proposal_value, plan_type, seats |
proposal_viewed | Prospect opens the proposal | deal_id, view_duration, pages_viewed, viewer_role |
contract_signed | Deal closed — contract executed | deal_id, account_id, contract_value, term_months, seats, sales_cycle_days |
// Sales pipeline — data layer push
dataLayer.push({
  event: "contract_signed",
  deal_id: "deal_4x8r2",
  account_id: "acc_8k2m9x",
  contract_value: 48000,
  term_months: 12,
  seats: 25,
  sales_cycle_days: 67
});
Why it matters: Without pipeline events in analytics, marketing can’t attribute revenue to campaigns and sales can’t identify where deals stall. The proposal_viewed event is especially valuable — tracking whether prospects actually read the proposal (and which pages they spend time on) gives sales reps actionable follow-up intelligence.
Multi-User and Team Events
Enterprise products are team tools. Tracking how users are invited, what roles they hold, and how teams adopt the product is critical for understanding seat utilization — which directly impacts expansion revenue and churn risk.
| Event Name | Trigger | Key Parameters |
|---|---|---|
user_invited | Existing user invites a teammate | account_id, inviter_role, invitee_role, invitation_method |
user_joined | Invited user accepts and joins | account_id, user_role, days_to_join, invitation_source |
role_changed | User’s role or permissions updated | account_id, user_id, previous_role, new_role |
team_created | New team or workspace created | account_id, team_name, team_size, created_by_role |
seat_limit_reached | Account hits licensed seat cap | account_id, current_seats, seat_limit, plan |
user_deactivated | User removed or deactivated | account_id, user_id, deactivation_reason, days_active |
// Multi-user — data layer push
dataLayer.push({
  event: "user_invited",
  account_id: "acc_8k2m9x",
  inviter_role: "admin",
  invitee_role: "member",
  invitation_method: "email"
});
Why it matters: Seat utilization is the strongest leading indicator of renewal. In my experience, accounts using less than 40% of their licensed seats have a 3× higher churn rate. The seat_limit_reached event is a direct expansion signal — when an account hits the cap, your sales team should be reaching out within 24 hours.
Feature Adoption Events
Enterprise products are complex. Tracking which features accounts actually use — and which they ignore — tells you whether they’re getting value from the product. This is product-qualified data that your customer success team needs.
| Event Name | Trigger | Key Parameters |
|---|---|---|
feature_activated | Account uses a feature for the first time | account_id, feature_name, feature_category, days_since_signup |
feature_used | Any feature interaction after first use | account_id, feature_name, user_role, session_feature_count |
integration_connected | Third-party integration enabled | account_id, integration_name, integration_category, setup_duration |
integration_disconnected | Integration removed or disabled | account_id, integration_name, disconnect_reason, days_connected |
api_key_created | Account generates an API key | account_id, api_scope, created_by_role |
export_completed | Data export or report generated | account_id, export_type, record_count, format |
// Feature adoption — data layer push
dataLayer.push({
  event: "feature_activated",
  account_id: "acc_8k2m9x",
  feature_name: "custom_reports",
  feature_category: "analytics",
  days_since_signup: 14
});
Why it matters: Feature adoption data powers product-led growth. When you know that accounts using 5+ features in the first 30 days retain at 92% versus 54% for those using fewer than 3, you can build targeted onboarding flows. The integration_connected event is particularly sticky — accounts with active integrations are 4× less likely to churn because switching costs increase.
Renewal and Expansion Events
In B2B, the initial contract is just the beginning. Net revenue retention — driven by renewals, expansions, and upsells — determines whether the business grows. These events track the post-sale revenue lifecycle.
| Event Name | Trigger | Key Parameters |
|---|---|---|
renewal_upcoming | Account enters renewal window (e.g., 90 days out) | account_id, renewal_date, current_arr, days_until_renewal |
renewal_completed | Contract renewed successfully | account_id, deal_id, new_arr, arr_change, term_months |
expansion_opportunity | Usage triggers upsell signal | account_id, trigger_type, current_usage, plan_limit |
seats_added | Account purchases additional seats | account_id, seats_added, total_seats, mrr_increase |
plan_upgraded | Move to a higher-tier plan | account_id, previous_plan, new_plan, arr_increase |
cancellation_requested | Account initiates cancellation | account_id, cancel_reason, current_arr, feedback, salvage_offer |
// Renewal and expansion — data layer push
dataLayer.push({
  event: "seats_added",
  account_id: "acc_8k2m9x",
  seats_added: 10,
  total_seats: 35,
  mrr_increase: 500
});
Why it matters: Expansion revenue is the engine of B2B growth. Companies with 120%+ net revenue retention grow even if they acquire zero new customers. The expansion_opportunity event — triggered when usage approaches plan limits — is the automation hook your revenue team needs. One client automated outreach on this event and increased expansion revenue by 35% in a single quarter.
Support and Health Score Events
Enterprise accounts generate support interactions that are strong indicators of satisfaction — or risk. Tracking these alongside product usage gives you a complete customer health score.
| Event Name | Trigger | Key Parameters |
|---|---|---|
support_ticket_created | New support ticket submitted | account_id, ticket_priority, ticket_category, user_role |
support_ticket_resolved | Ticket marked as resolved | account_id, ticket_id, resolution_time_hours, satisfaction_score |
nps_submitted | User completes NPS survey | account_id, nps_score, user_role, feedback_text_length |
health_score_changed | Account health score crosses threshold | account_id, previous_score, new_score, change_drivers |
csm_meeting_completed | Customer success check-in finished | account_id, meeting_type, attendee_count, action_items |
escalation_triggered | Issue escalated to senior support | account_id, ticket_id, escalation_reason, account_arr |
// Support and health — data layer push
dataLayer.push({
  event: "health_score_changed",
  account_id: "acc_8k2m9x",
  previous_score: 82,
  new_score: 61,
  change_drivers: "low_usage,open_tickets"
});
Why it matters: Health scores collapse multiple signals into a single actionable metric. The health_score_changed event fires when the score crosses defined thresholds — say, dropping below 70 — and triggers an automated alert to the CSM. In one implementation, this early warning system reduced unexpected churn by 28% because the team could intervene before customers reached the cancellation page.
B2B-Specific Metrics and KPIs
These events feed the metrics that B2B leaders actually care about. Here’s how they map together.
| Metric | Formula (from events) | Benchmark |
|---|---|---|
| Net Revenue Retention (NRR) | (Starting ARR + expansion − contraction − churn) / Starting ARR | >110% good, >130% excellent |
| Sales Cycle Length | Avg sales_cycle_days from contract_signed | 30-90 days (varies by ACV) |
| Seat Utilization | Active users / licensed seats per account | >60% healthy |
| Feature Adoption Rate | Accounts using feature / total accounts | Varies by feature tier |
| Time to First Value | Days between account_created and account_activated | <14 days ideal |
| Demo-to-Close Rate | contract_signed / demo_completed | 15-30% for enterprise |
| Expansion Revenue % | ARR from seats_added + plan_upgraded / total new ARR | >30% of new ARR |
| Customer Health Score | Composite of usage, support, NPS, engagement | >70 healthy, <50 at risk |
Implementation Checklist
B2B Event Schema — Quick Start
- Set up
account_idas a user property in GA4 — this is your primary grouping dimension - Implement account lifecycle events first — they’re the foundation for everything else
- Add
company_sizeandindustryas user-scoped dimensions for segmentation - Connect CRM pipeline events via server-side tracking — don’t rely on client-side for deal data
- Track
user_roleon every event — admins, managers, and individual contributors have different adoption patterns - Fire
feature_activatedonly on first use per account (not per user) to avoid inflation - Set up
seat_limit_reachedandexpansion_opportunityas real-time alerts - Build a composite health score from usage frequency, feature breadth, support sentiment, and NPS
- Use BigQuery export for account-level analysis — GA4 UI is user-centric by design
- Validate that
account_idjoins correctly between your analytics and CRM data
Related Guides on EU-Medin
- SaaS Event Schema: The Complete Reference
- Lead Gen Event Schema: The Complete Reference
- GA4 Event Naming Conventions: The Complete Reference
- E-commerce Event Schema: The Complete Reference
- Marketplace Event Schema: The Complete Reference
- Content & Media Event Schema: The Complete Reference
- UTM Parameters: The Complete Reference
- Server-Side Tracking: The Complete Guide
- Mobile App Event Schema: The Complete Reference
Further Reading
- GA4 Custom Dimensions and Metrics — Google Analytics Help
- GA4 User Properties — setting up account-level properties
- BigQuery Export for Analytics — account-level analysis at scale
- Server-Side GTM — required for CRM pipeline integration
Lukas Meier — Product Analytics Specialist based in Munich. Helping European teams build clean, GDPR-aware tracking across B2B and enterprise products. More about the author
Lukas Meier
Product Analytics Specialist with 10 years of experience configuring tracking for e-commerce and SaaS products across Europe. Creator of EU-Medin.
more →