Skip to content
Home » Project Type

Project Type

Analytics implementation guides organized by business model and project type.

A laptop displaying an analytics dashboard, representing feature adoption measurement

Feature Adoption Metrics: Measuring What Sticks in SaaS

Feature adoption metrics answer a question that ships-it culture loves to avoid: did anyone actually use the thing we built? Teams celebrate a launch, watch a release-day spike, and move on — never noticing that the feature flatlined a week… 

Flat illustration of analytics charts and graphs, representing product metrics

North Star Metrics: Choosing One That Isn’t a Vanity Number

North Star Metrics get picked in a hurry and regretted at leisure. A team needs “one number to rally around,” someone suggests signups or pageviews, everyone nods, and six months later the metric is going up while the business is… 

Abstract fingerprint and privacy icons, representing data protection in a healthtech product

Healthtech Event Schema: Tracking Without Touching Health Data

Healthtech is the vertical where a single careless event parameter can turn a product-analytics dataset into a regulated health record. Under the GDPR, data about someone’s health is a special category — Article 9 — with protections far stricter than… 

Online payment and card security illustration representing fintech event schema

Fintech Event Schema: KYC, Onboarding, Transactions

Fintech is the vertical where analytics and compliance collide hardest. The events that matter most to the business — KYC approvals, first transactions, dispute rates — are also the events most likely to carry regulated data. A payload designed for… 

Warning chart visualizing user churn signals 30 days before cancellation

Churn Signals You Should Be Tracking 30 Days Before It Happens

By the time a SaaS user cancels, you’ve already lost. The cancellation is the announcement, not the decision — that decision was made weeks earlier, after a series of behavioral signals that almost nobody bothered to track. The good news… 

Activation funnel diagram showing 5 SaaS user journey stages from signup to aha moment

The Activation Funnel: 5 Stages Every SaaS Should Measure

Most SaaS founders I talk to can name their conversion rate to the second decimal. Almost none can tell me what fraction of their signups become activated users — because they haven’t decided what activation means. That’s the gap this… 

Startup checklist for tracking activation metrics and aha moment

Activation Metrics: How to Track Your Aha Moment

Reading time: 8 min · Last updated: March 2026 Every product has a moment where a new user “gets it.” Slack’s was 2,000 messages. Dropbox’s was uploading the first file. Finding and tracking your aha moment is the single highest-leverage… 

Ecommerce growth chart with recurring revenue hologram representing subscription event schema

Subscription Event Schema: The Complete Reference

Subscription businesses run on five revenue metrics — MRR, trial-to-paid, expansion, churn, and reactivation — and every one of them is built from the events below. When I joined a Berlin SaaS client in 2023, their billing system fired four… 

Abandoned shopping cart with email envelope illustration representing cart abandonment recovery events

The Cart Abandonment Signal: 7 Events You’re Probably Missing

Standard ecommerce tracking gives you four events — view_item, add_to_cart, begin_checkout, purchase — and calls anything in between “abandonment.” For one DACH apparel client in 2024, those four events left us blind to 38% of the drop-off. The biggest losses… 

Diagram showing marketplace event schema with demand and supply side events

Marketplace Event Schema: The Complete Reference

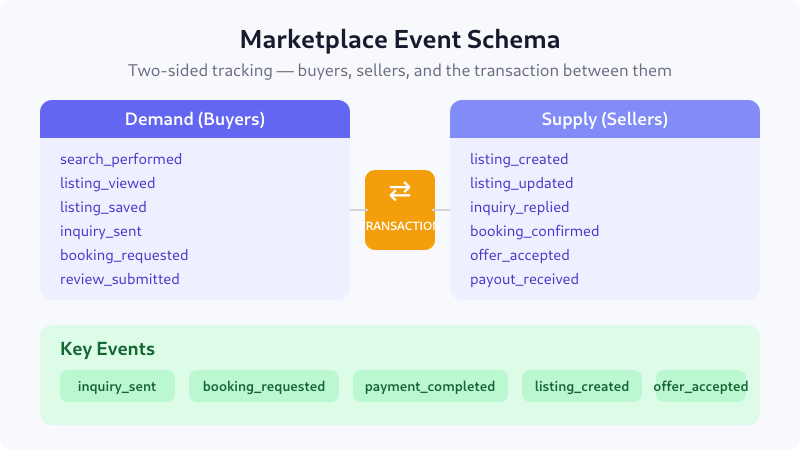
A complete reference for marketplace analytics. All events — from listing creation to completed transaction — with parameters, data types, and data layer examples you can copy into your tracking plan. Marketplace tracking is fundamentally different from standard e-commerce. You…