activation
 Lukas Meier
·
6 min read
Lukas Meier
·
6 min read
Feature Adoption Metrics: Measuring What Sticks in SaaS
Feature adoption metrics answer a question that ships-it culture loves to avoid: did anyone actually use the thing…
Guides organized by user journey stage: from first touch to long-term retention.
Feature adoption metrics answer a question that ships-it culture loves to avoid: did anyone actually use the thing…

North Star Metrics get picked in a hurry and regretted at leisure. A team needs “one number to…

By the time a SaaS user cancels, you’ve already lost. The cancellation is the announcement, not the decision…

Every product team I’ve worked with eventually starts looking at retention curves. And almost every team gets the…
Most SaaS founders I talk to can name their conversion rate to the second decimal. Almost none can…

I’ve seen cohort grids used to justify bad investment decisions at least three times. Each time, the problem…
Reading time: 8 min · Last updated: March 2026 Every product has a moment where a new user…

Standard ecommerce tracking gives you four events — view_item, add_to_cart, begin_checkout, purchase — and calls anything in between…
Reading time: 9 min · Last updated: March 2026 Acquisition is the funnel stage that gets the most…
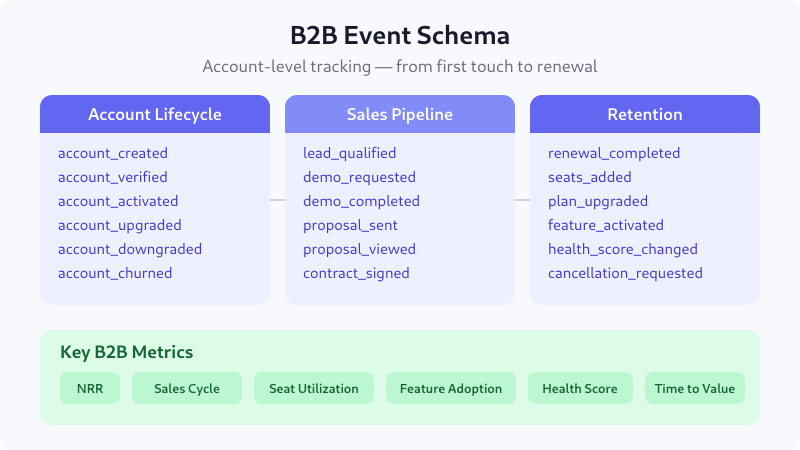
B2B products don’t convert in a single session. A buyer researches for weeks, loops in stakeholders, requests a…